Track you Google Play metrics with Grafana
12 August 2023
Feel the excitement. Just connect the API, place a TV or a monitor in a visible place at your home or office and stare at the graphs. Is my update liked? Are people reaching my product? What are the sentiments about the latest app I released?
Grafana is a free and open-source tool to display dashboards full of widgets: tables, graphs, charts, you name it. Google offers an API that you can use to query data from your Google Play developer console. With a little scripting it is possible to get the data from the API and feed it to Grafana, so that you can motivate yourself to keep working on your app.
But to store data that Grafana will query we need some kind of a database or a service that will hold this data. There are multiple standard connectors in Grafana that we can use: JSON, Graphite, Prometheus. For simplicity, our script will be scraped by Prometheus that will keep the data in its own database.
Getting the keys - service account
To enable an API access to your Google Play developer console, go to the main
console site, click Setup in the left menu and API Access. You will be given
instructions how to create a Google Cloud project to link to your account.
Follow
this guide
for more details.
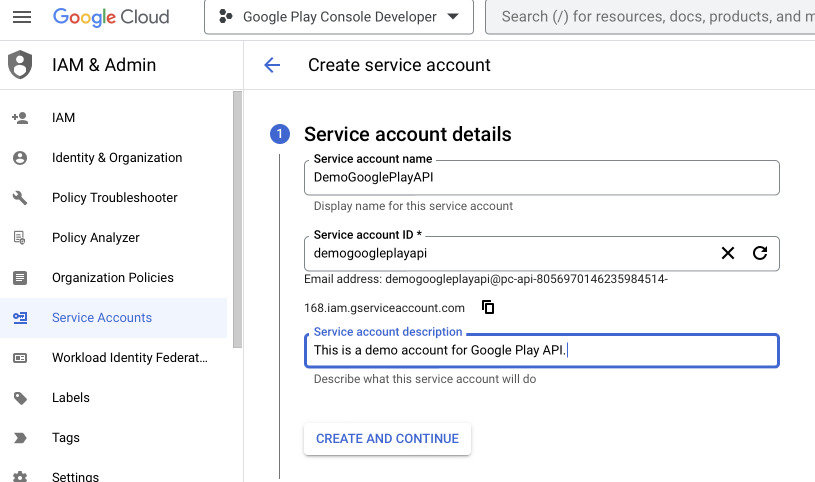
To create Service Account, go to the Google Cloud Project you made for Google
Play, select APIs & Services and then Credentials. Create a new Service
Account and add Editor permissions to it.
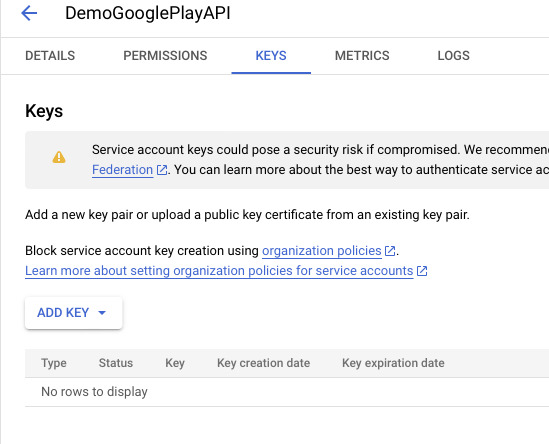
After you are redirected to the list of service accounts, click on the recently
created and go to Keys tab. Add new JSON key, download and keep secure.
Creating a Python script
We will write a Python script that on /metrics HTTP request will report all
the data we would like to pull from Google Play. The script will authenticate
using standard Google Cloud Service Account and query the REST API of Play
Console.
Let's start by installing the required libraries with pip.
$ cat > requirements.txt <<EOF
google-api-python-client
oauth2client
prometheus-client
google-cloud-storage
pandas
EOF
$ pip install -r requirements.txt
Getting the reports
Go to Google Play Developer console, select API access, look for the service
account that you just created, click manage permissions and add
View app information and download bulk reports permission and optionally
View financial data if you want to track your revenue. Now you should be able
to download your reports but there's a caveat: you have to wait around 24
hours for the permissions to apply to new objects.
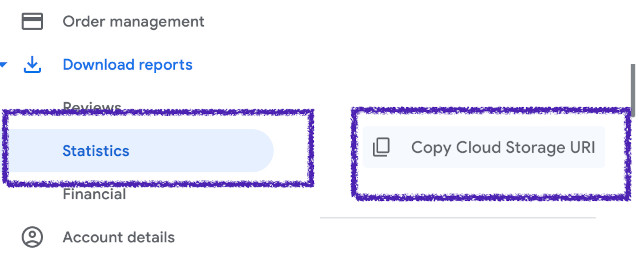
After the time we can try to get information with a script. Let's start with
getting the URI of the storage bucket. To do this go to the main console page,
click Download reports -> Statistics -> Copy Cloud Storage URI. Paste it
into the script below.
from io import StringIO
from datetime import datetime
from google.cloud import storage
import pandas

MONTH = datetime.now().strftime("%Y%m")
SCOPE = "https://www.googleapis.com/auth/devstorage.read_only"
# You package name
APP = "com.mycompany.myapp"
# Here goes the key you downloaded
KEY = "pc-api-124567890-12345678abcd.json"
# Copied from Google Play Console
STATISTICS_URI = "gs://pubsite_prod_rev_01123456789900/stats/installs/"
BUCKET = STATISTICS_URI.split("/")[2]
OBJECT = f"stats/installs/installs_{APP}_{MONTH}_overview.csv"

### Using Google Cloud Storage API
storageClient = storage.Client.from_service_account_json(KEY)
bucket = storageClient.get_bucket(BUCKET)
blob = bucket.blob(OBJECT)
statistics = blob.download_as_string().decode('utf-16')

df = pandas.read_csv(StringIO(statistics), sep=",")
print(df[["Date", "Total User Installs", "Update events"]])
This script will use Google Cloud Storage API to download the CSV file to which
permissions should have been granted when we allowed our service account to
access Play Console. The script will print some sample headers from the current
month (if you are doing it in the beginning of the month, try to hardcode the
date for the previous month, like 202307). But this is not all the data we
want to gather.
Getting the vitals
Vitals are very important metrics that not so long ago were only available in
Google Play Console. But there's an API still in beta that allows us to get
crash rates and ANRs. As my apps have little activity, I will use error.counts
resource. You can find more information about it in
Google Play Developer Reporting API. This time we will use Google API Client library.
from apiclient.discovery import build
from oauth2client.service_account import ServiceAccountCredentials
from datetime import datetime, timedelta

SCOPE = "https://www.googleapis.com/auth/playdeveloperreporting"
# You package name
APP = "com.mycompany.myapp"
# Here goes the key you downloaded
KEY = "pc-api-124567890-12345678abcd.json"

creds = ServiceAccountCredentials.from_json_keyfile_name(KEY, [SCOPE])
service = build('playdeveloperreporting', 'v1beta1', credentials=creds)
errors = service.vitals().errors().counts()

freshness = crashrate.get(name=f"apps/{APP}/errorCountMetricSet").execute()
freshness = freshness["freshnessInfo"]["freshnesses"]
# This will create a map of freshnesses by aggregation period
freshness = {f['aggregationPeriod']: f for f in freshness}
endTime = freshness["DAILY"]["latestEndTime"]

# Construct date for the previous day
lastDay = datetime(endTime['year'], endTime['month'], endTime['day'], endTime['hours'])
prevDay = lastDay - timedelta(days=2)
del endTime['hours']

# Create the query
body = {
  "metrics": ["distinctUsers"],
  "dimensions": ["reportType"],
  "timelineSpec": {
    "aggregationPeriod": "DAILY",
    "startTime": {
        "timeZone": endTime['timeZone'],
        "year": prevDay.year,
        "month": prevDay.month,
        "day": prevDay.day
    },
    "endTime": endTime
  }
}

counts = errors.query(name=f"apps/{APP}/errorCountMetricSet", body=body).execute()

if "rows" not in counts:
    print("No data")
    exit(0)

records = []
for row in counts['rows']:
    date = row['startTime']
    date = f"{date['year']}-{date['month']}-{date['day']}"
    reportType = row['dimensions'][0]['stringValue']
    value = float(row['metrics'][0]['decimalValue']['value'])
    records.append((date, reportType, value))

# Dump data to CSV to see what we got
import pandas
df = pandas.DataFrame.from_records(records, columns=["Date", "Report Type", "Value"])
with open("counts.csv", "w") as f:
    df.to_csv(f, index=False)
If you have low activity in your up, change the timedelta days to a bigger
value like 30. It is possible that rows will not be returned if you have
only zeros. In this case you can try to shift the date range to something that
you know contains data.
Packing everything into a single program
Now it would be useful for us to set up a package that will contain all the code
we just wrote. We will create a new directory src with __init__.py file and
create files crashes.py and installs.py. Both will contain the code above
packed into classes for easier use. We will also create a main.py file that
will import and instantiate both classes, initialize Prometheus library and push
the values.
The classes can be found in the GitHub repository. It also contains already a main file that exposes the metrics via Prometheus. We will cover this code together with Grafana configuration and packing it into Docker in the next post.