Functionality decoupling into microservices - part 5
21 May 2023
Previously we created a passthrough in our monolith service into the fruits microservice. This is useful for users that still use the old endpoints, the old frontend. However, in order to save on bandwidth, we prefer for the users to call the microservice directly. For that we will change our frontend. Because we want to keep everything decoupled we will use XHR requests in JavaScript. If we kept using pure HTML pages, we would need to include the redirect configuration inside our microservice or pass the config every time.
Previous parts:
- Part 1 - Monolith implementation
- Part 2 - Data split into Redis
- Part 3 - Microservice implementation
- Part 4 - Passthrough to microservice
Getting and using token
getToken functionality is already present in the router. We will store the
token in user's localStorage to prevent too many calls for its regeneration.
Because JWT is JSON, we can use JavaScript to check if the current token is
worth to be reused. For convenience, I use jQuery.
function requestToken() {
    return new Promise((resolve, reject) => {
        $.get("/token")
            .done(function (data) {
                localStorage.setItem("token", data);
                resolve(data);
            })
            .fail(function (xhr, status, error) {
                alert("Got error code " + xhr.status + " while requesting token");
                reject(error);
            });
    });
}

/* Checks if the token in localStorage is still usable or requests a new one */
function getToken() {
    return new Promise((resolve, reject) => {
        let token = localStorage.getItem("token");

        if (token == null)
            requestToken()
                .then( (newToken) => resolve(newToken) )
                .catch( (error) => reject(error) );
        else {
            let body = JSON.parse(atob(token.split('.')[1]));
            let now = Math.floor(Date.now() / 1000) + 2; // at most 2s until expire

            if (now > body['exp'])
                requestToken()
                    .then( (newToken) => resolve(newToken) )
                    .catch( (error) => reject(error) );
            else resolve(token);
        }
    });
}
Getting fruits from microservice
To get the fruits from the microservice we will also use XHR request. We have to
prepare the template in the monolith and add IDs to the elements that we will
use for displaying the results or errors. In page.go replace the template for
range into a static DOM pieces:
<div id="fruits-error" style="display:none">
    Error loading fruits: <span id="fruits-error-content">unknown</span>
    <button id="fruits-retry">Retry</button>
</div>
<ul id="fruits">
</ul>
Also remember to remove remove the parameters related to displaying list of users and fruits passed to the template. The new list all fruits function will look like this:
func ListAllFruits(w http.ResponseWriter, r *http.Request) {
    w.Header().Add("Content-Type", "text/html")
    w.WriteHeader(http.StatusOK)
    printIndexPage(activateSession(r), w)
}
Next up is time to implement our JavaScript for getting the list of the fruits. We will call the function after the page loads. Also add a global constant so that we can configure the microservice endpoint in one place.
const FRUITS_MICROSERVICE_ENDPOINT="{{.FruitsEndpoint}}"; // This is templated in Go

function getFruits() {
    $("#fruits-error").css({"display": "none"}); // Clear error
    $.get(FRUITS_MICROSERVICE_ENDPOINT + "/")
        .done((data) => {
            $("ul#fruits").empty();
            data.forEach( (pair) => {
                let li = $("<li>").text(pair.username + ": "+ pair.fruit);
                $("ul#fruits").append(li);
            });
        })
        .fail((xhr, status, error) => {
            $("#fruits-error-content").text(error);
            $("#fruits-error").css({"display": "block"});
        });
}

// On page load
$(()=>{
    $("#fruits-retry").on("click", ()=> getFruits() );
    getFruits();
});
Let's try getting the list of fruits to verify that our frontend works with the microservice. It's not very effective! We are blocked by CORS policies. In order to fix this, we have to add headers to our microservice.
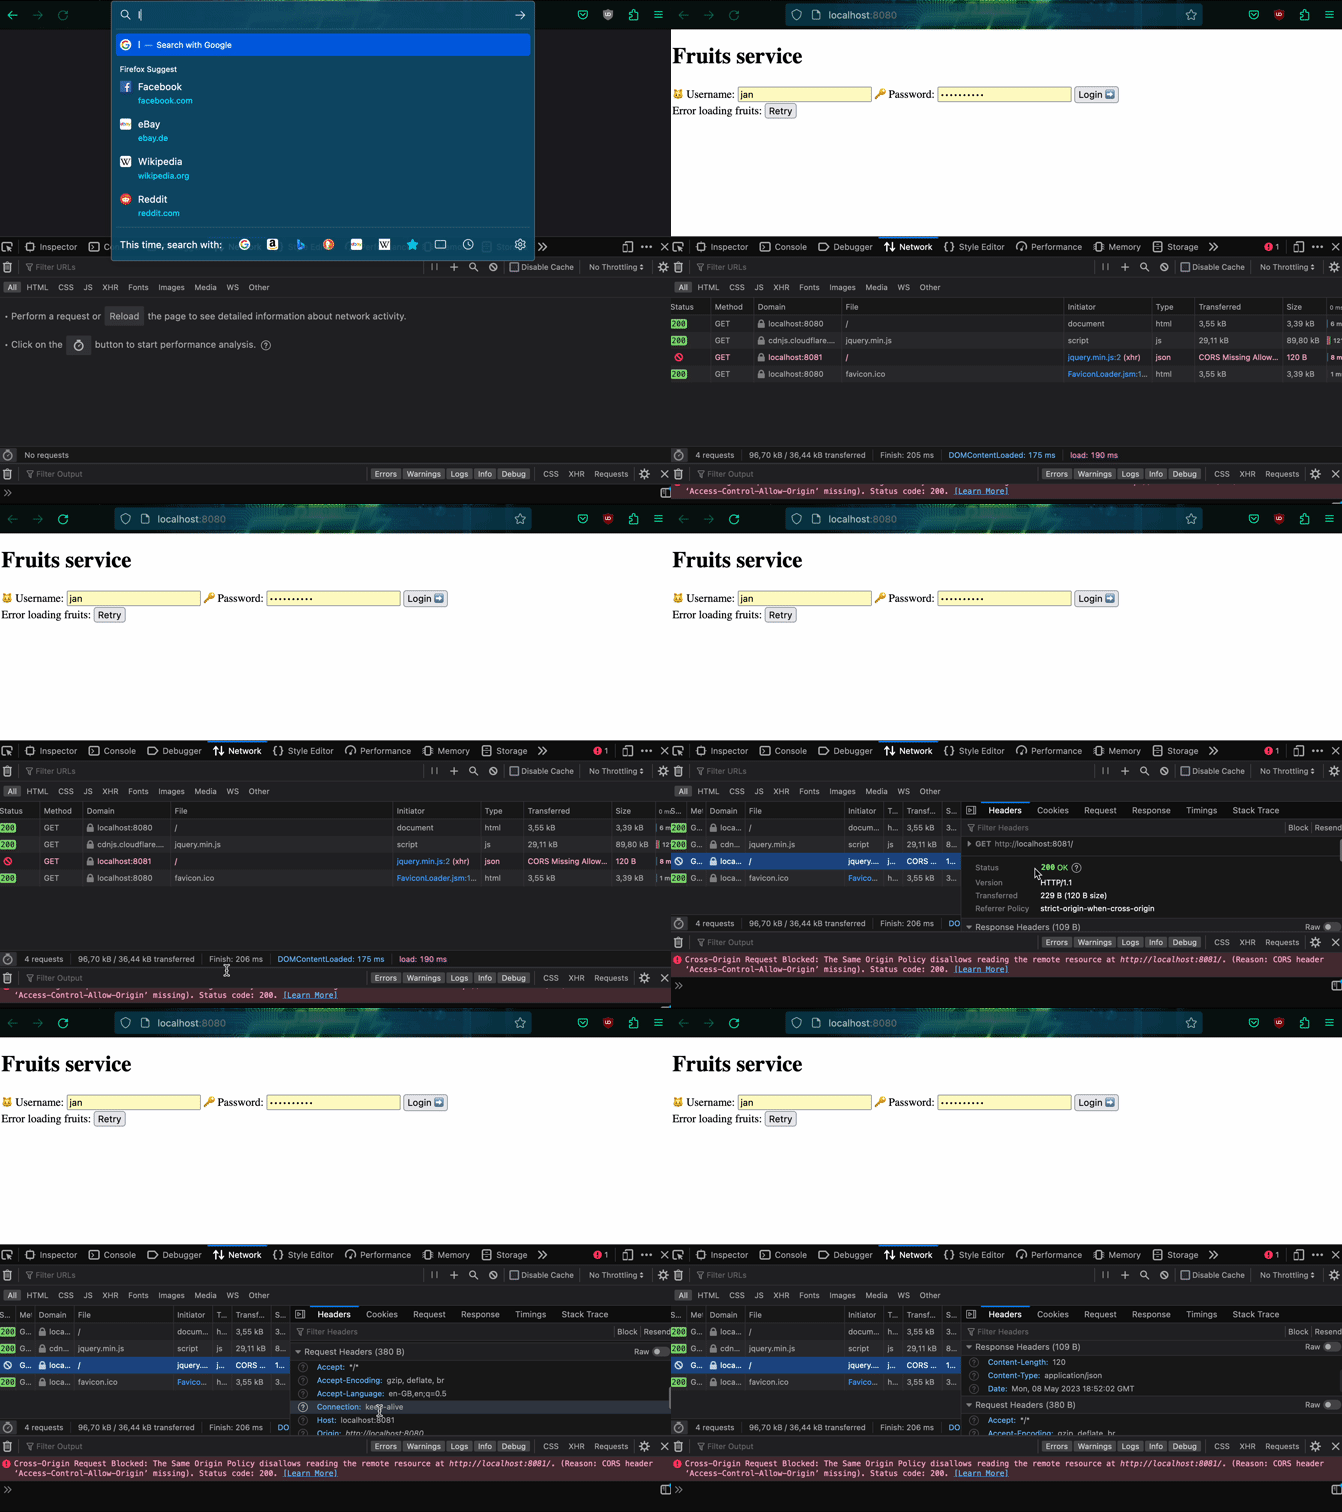
CORS policy for microservice
Sometimes also XHR requests might query the server with OPTIONS method. We
will allow it giving some generic response. Below is the function to be added to
serve.go in the microservice. The headers are not specific to any function,
rather shared between them. In production you might want to limit what is
allowed at which endpoint. What is more, the config.Origin is shared and
currently set only for the monolith's frontend (for example
http://localhost:8080). In case you would like to allow more origins, like an
app and browser frontend you need to read the client's Origin header first and
check if it is allowed. The same goes for methods and allowed headers.
func corsPreflight(w http.ResponseWriter, r *http.Request) bool {
    w.Header().Add("Access-Control-Allow-Origin", config.Origin) // Always add origin
    if r.Method == "OPTIONS" {
        w.Header().Add("Access-Control-Allow-Methods", "POST, PUT, GET")
        w.Header().Add("Access-Control-Allow-Headers", "Authorization, Content-Type, X-Auth-Token")
        w.WriteHeader(http.StatusOK)
        log.Default().Printf("[200] [%s] %q CORS preflight\n", r.RemoteAddr, r.URL.Path)
        return true
    }
    return false
}
This function should be called at the beginning of every handler in an if
statement. If it returns true the handler should return. This time the headers
are there so the microservice is allowed to be called from the frontend.
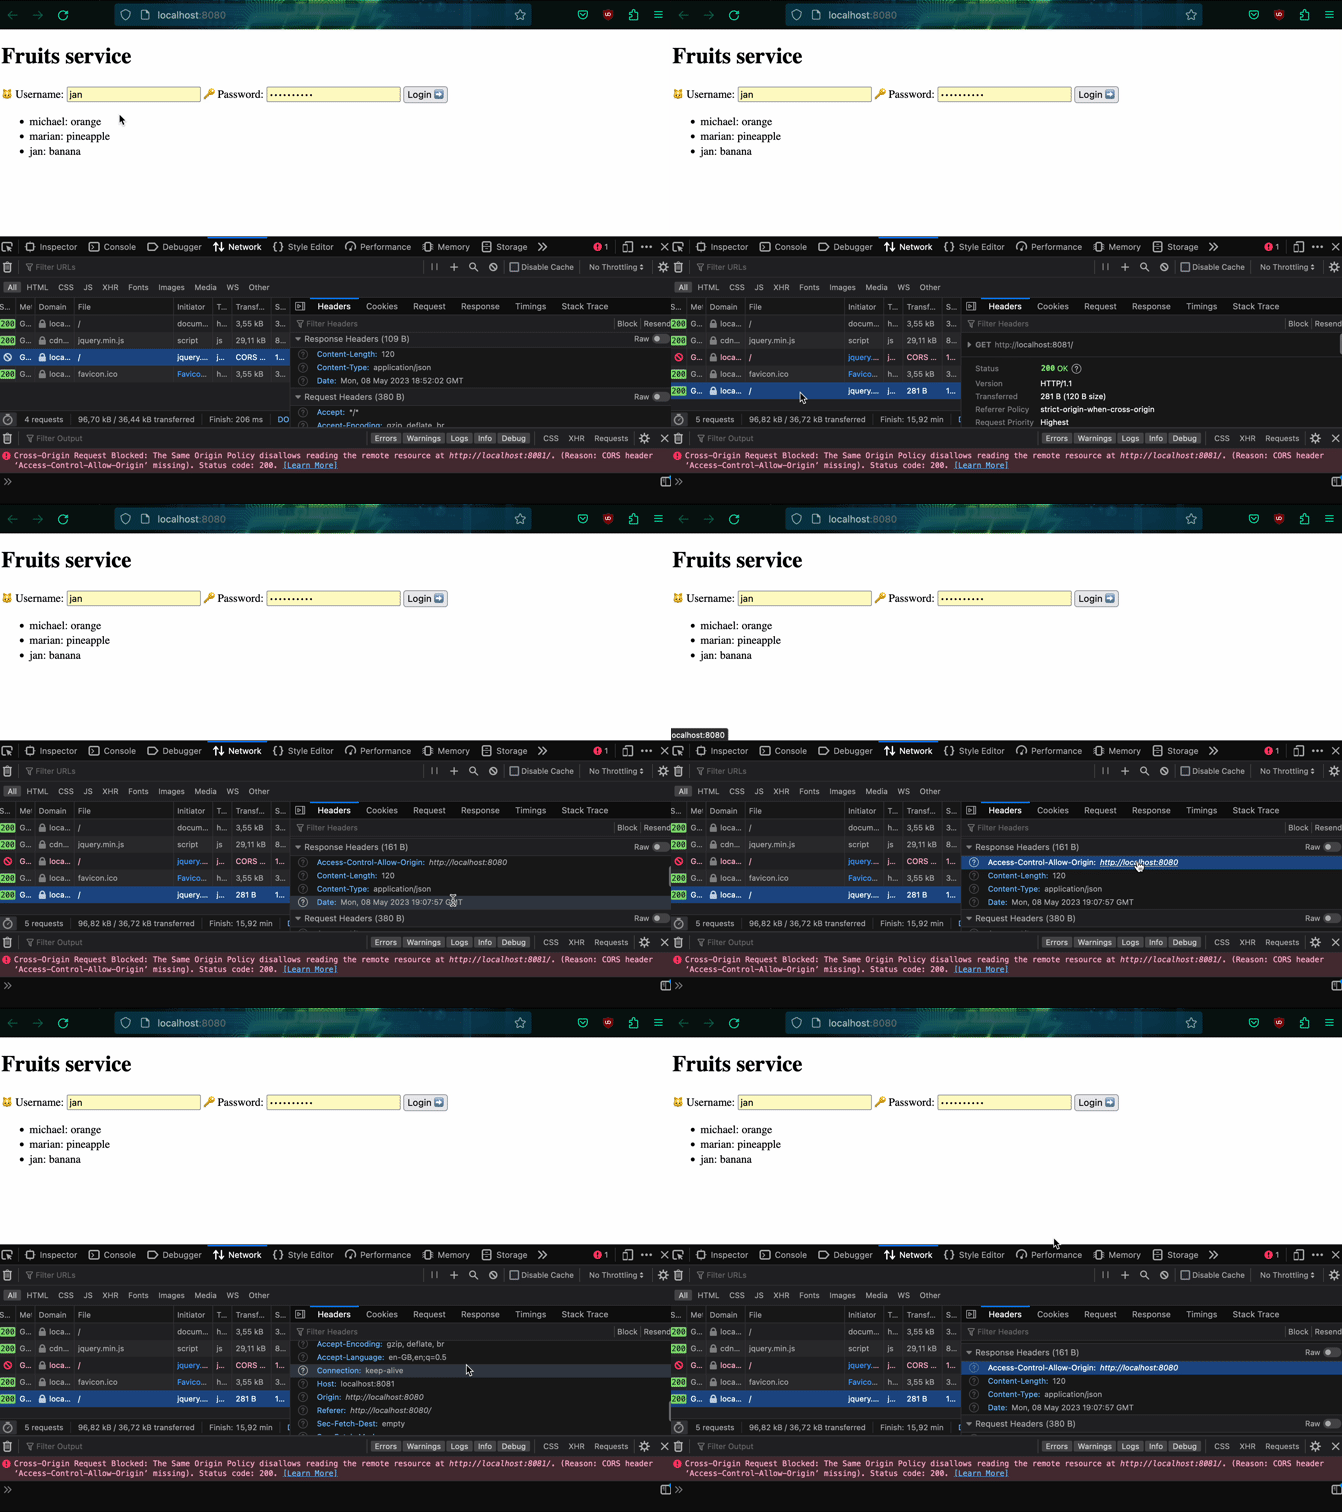
Finally when we have getting the list of the fruits working, we can continue to implement the rest of the functionality. The updated version of the microservice is 1.0.1.
Setting the fruit
Now we will use previously implemented function for getting the token and
storing it if it still can be reused. First let's remove our standard HTML
form and replace submit input with a <button> element.
<label for="fruit">Fruit:</label>
<select name="fruit" id="fruit">
    ...
</select>
<button id="set-fruit">Set fruit</button>
Next up we will implement XHR function that will submit contents of the select
to the microservice along with the token in the headers. There are many errors
we can handle along the way. For now we will just display alert()s.
async function setFruit() {
    let fruit = $("#fruit").val(); // Get the current value of the select
    $("#set-fruit").prop("disabled", true); // Disable another form submission
    try {
        let token = await getToken(); // Get the cached token or a new one
        $.ajax({
            url: FRUITS_MICROSERVICE_ENDPOINT + "/fruit",
            method: "PUT",
            headers: { "X-Auth-Token": token },
            data: { "fruit": fruit }
        })
        .done( () => getFruits() ) // Refresh the list of fruits
        .fail( (x, s, e) => alert("Error setting fruit [" + x.status + "]: " + e) )
        .always( () => $("#set-fruit").prop("disabled", false) ); // Reenable the form
    } catch(error) {
        alert("Error setting fruit: " + error);
        $("#set-fruit").prop("disabled", false);
    }
}

// Bind the button to the function
$(()=>{
    $("#set-fruit").on("click", ()=> setFruit() );
});
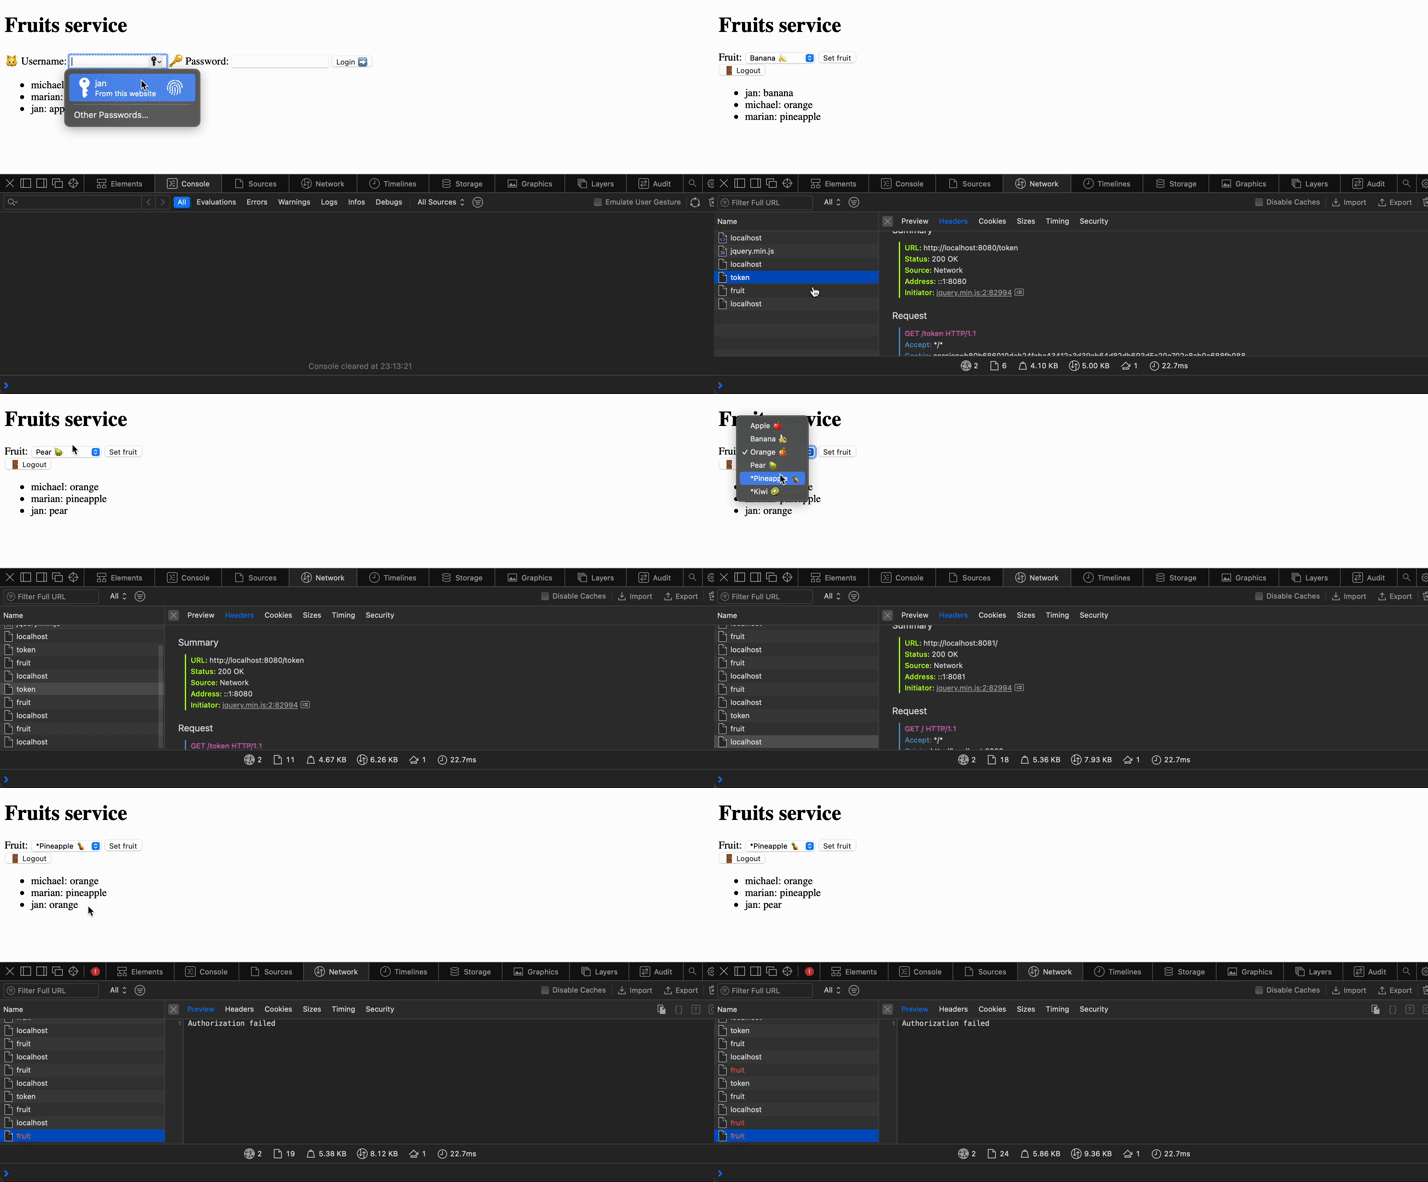
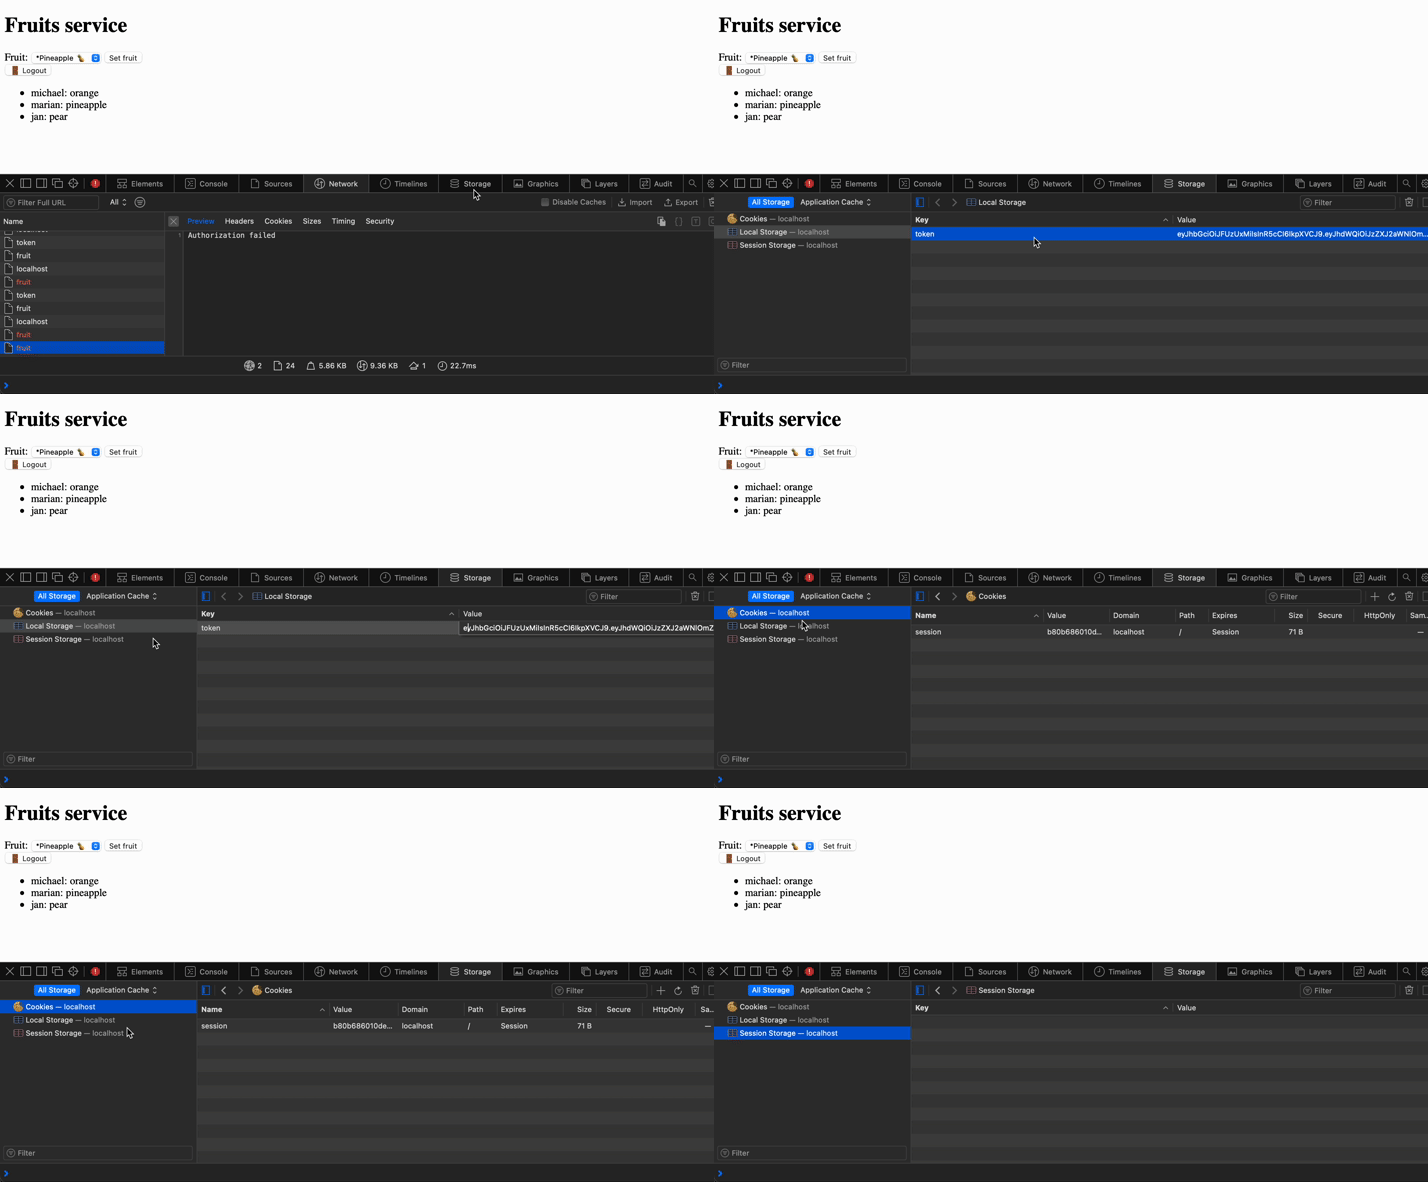
Seems like we have implemented everything we planned. Let's see how it behaves. We can also see the token being stored in session storage and the cookie from the monolith service for authentication to the user account.
Deprecating old endpoints
Before we can deprecate old endpoints, we need to make sure that nobody is using them. We can check the logs of the service but let's make it more convenient. We will use OpenMetrics standard with Prometheus packages.
go get github.com/prometheus/client_golang/prometheus
go get github.com/prometheus/client_golang/prometheus/promauto
go get github.com/prometheus/client_golang/prometheus/promhttp
And in Go we can implement now some simple counters. We will use them to count some events. And we will put the counter increments in appropriate places.
package router

import (
    "github.com/prometheus/client_golang/prometheus"
    "github.com/prometheus/client_golang/prometheus/promauto"
)

var SetFruitAccesses = promauto.NewCounter(prometheus.CounterOpts{
    Name: "set_fruit_accesses_total",
    Help: "The total number of accesses to SetFruit with any method",
})

var GetTokenAccesses = promauto.NewCounter(prometheus.CounterOpts{
...
func SetFruit(w http.ResponseWriter, r *http.Request) {
    // Sets a fruit
    // path = PUT /fruit, POST /fruit
    SetFruitAccesses.Inc()
    if r.Method != "PUT" && r.Method != "POST" {
    ...
In order to view our metrics, we need to add an endpoint to the router (or start
a second HTTP server). We will use /metrics that will redirect to Prometheus'
promhttp.Handler but we will intercept the request to check for a header that
will give us access to the metrics. This is useful if you want to simplify
reverse proxy and not deal with allowed IP addresses - if you set check to
localhost, the reverse proxy will also just serve it unless configured.
func PresentMetrics(w http.ResponseWriter, r *http.Request) {
    // empty username, "MySuperSecretCode" password
    if r.Header.Get("Authorization") == "Basic Ok15U3VwZXJTZWNyZXRDb2Rl" {
        promhttp.Handler().ServeHTTP(w, r)
    } else {
        w.Header().Set("WWW-Authenticate", "Basic realm=\"metrics\"")
        w.WriteHeader(http.StatusUnauthorized)
        w.Write([]byte("forbidden"))
    }
}

// In serve.go
mux.HandleFunc("/metrics", PresentMetrics)
In order to scrape the metrics using Prometheus and display them using Grafana, we will put our monolith also into a Docker container and add it to the compose stack. Then we can also attach Grafana and Prometheus on the same network. The whole file is available in the repository.
  grafana:
    image: grafana/grafana:latest
    ports:
      - 3030:3000

  prometheus:
    image: prom/prometheus:latest
    ports:
      - 9090:9090
    volumes:
      - ./prometheus.yml:/etc/prometheus/prometheus.yml

  monolith:
    build: .
    ports:
      - 8080:8080
    depends_on:
      - fruits
    environment:
      - FRUITS_ENDPOINT=http://fruits:8081
      - PRIVATE_KEY_FILE=/run/secrets/private_key
      - USE_DB_FILE=/run/database.db
    volumes:
      - type: bind
        source: ./server.pem
        target: /run/secrets/private_key
        read_only: true
      - ./monolith.db:/run/database.db
The Dockerfile for the monolith requires also some Cgo dependencies for SQLite and looks like the following:
FROM golang:1.20-alpine AS builder
ENV CGO_ENABLED=1
RUN apk add --no-cache gcc musl-dev
WORKDIR /app
COPY . .
RUN go build -o main

FROM alpine:latest
WORKDIR /app
COPY --from=builder /app/main /usr/local/bin/monolith
ENTRYPOINT ["/usr/local/bin/monolith", "-serve"]
In order to collect metrics from our monolith, we need to configure Prometheus
scraping. To do this, we need to edit prometheus.yml.
scrape_configs:
  - job_name: monolith
    scrape_interval: 20s
    static_configs:
      - targets:
          - monolith:8080
    basic_auth:
      username: ""
      password: MySuperSecretCode
    enable_http2: false
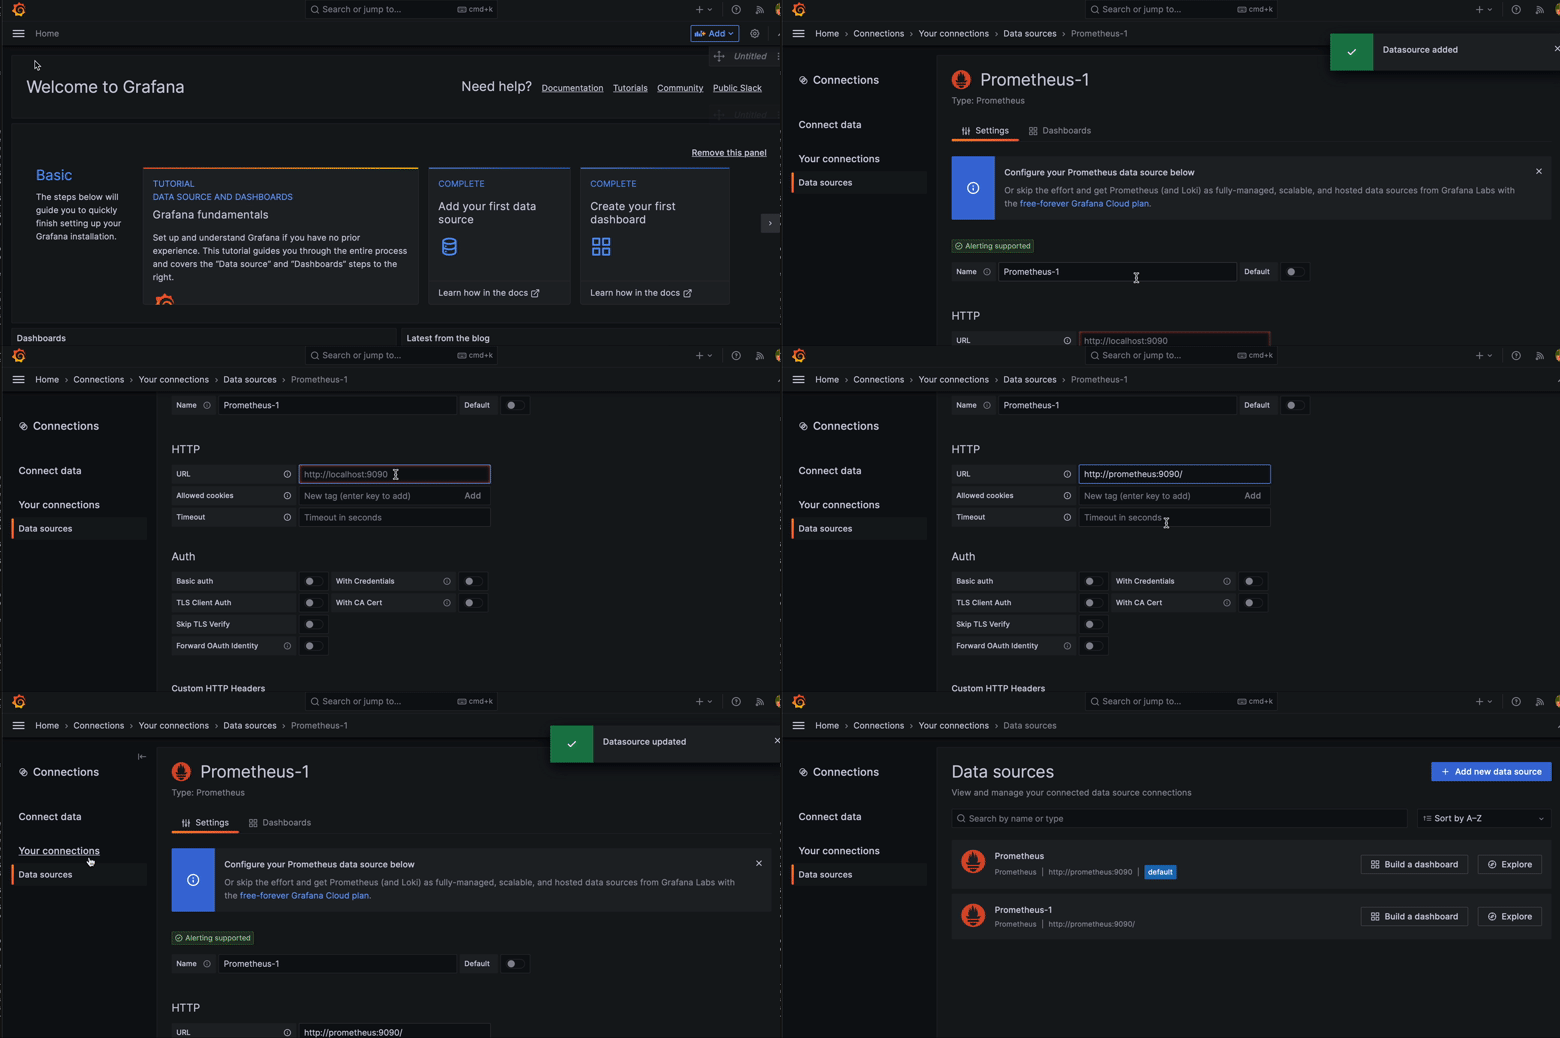
After easily connecting local Prometheus to Grafana we should see the metrics
and be able to create a dashboard. By bringing up the stack with
docker-compose up -d we should be able to access Grafana under
http://localhost:3030 (as configured in the above example, use admin/admin).
Prometheus should also be accessible via http://localhost:9090 in the browser.
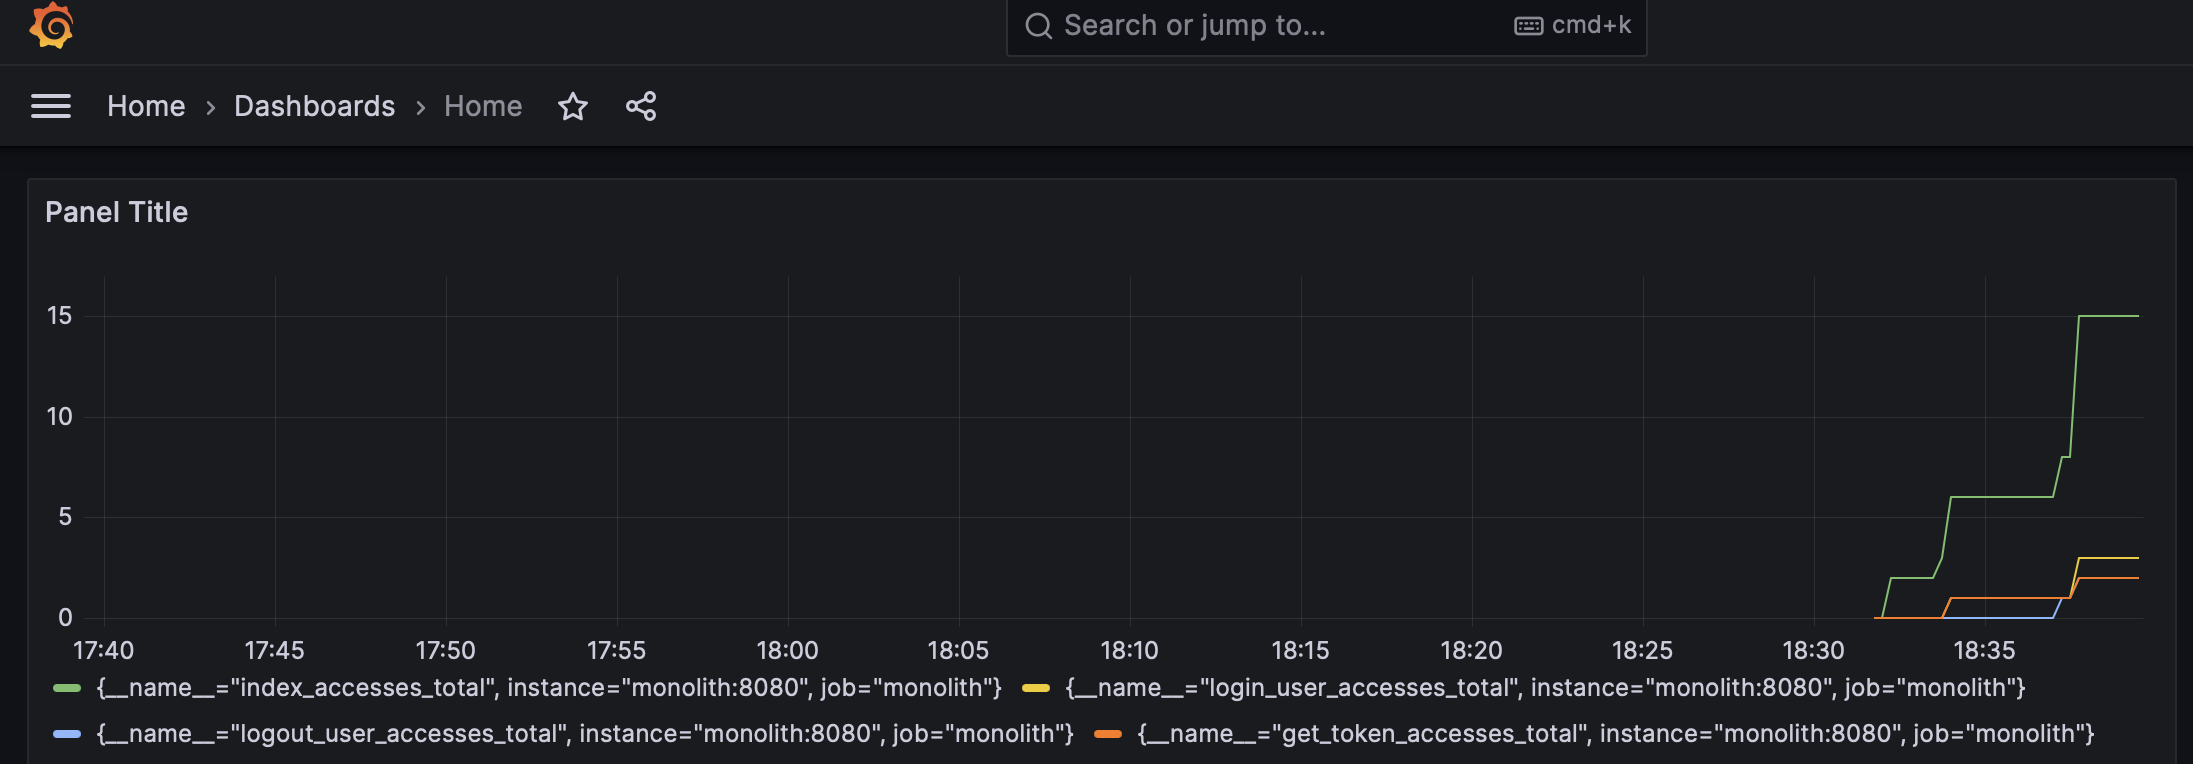
That way we can know when our users stop accessing the old endpoints and we can
then create an update deprecating them. Last version of the monolith is tagged
as 1.3.1.