Track your performance using Habitica, Timestream and Grafana
05 July 2024
Habitica is an excellent tool for keeping yourself sticking to what you planned for yourself. Although it doesn't work for everyone, it is nevertheless worth trying. (This is my third try in using Habitica and it seems to be working with the longest streak of 949 days.) As discussed in the previous post, Habitica has an API that lets you retrieve data from the app and perform actions. As a warmup, we created a simple Lambda script that sells excess items in our Habitica inventory. Today, we are going to create a similar scheduled Lambda function that will collect statistics of our profiles and store them in Amazon Timestream database. Later we will be able to view the data using Grafana.
Creating Timestream database and table
This is a very simple step. In the same template.yaml
file as before,
place new resources for Timestream. It is a standard CloudFormation resource
and doesn't take too many parameters. I decided to set the memory storage to 7
days as our function will not collect so much data so it won't cost you a lot.
  # Database and table for collecting Habitica statistics
  HabiticaStatsTimestream:
    Type: AWS::Timestream::Database
    Properties:
      DatabaseName: HabiticaStats

  HabiticaStatsTable:
    Type: AWS::Timestream::Table
    Properties:
      TableName: HabiticaStatsTable
      DatabaseName: !Ref HabiticaStatsTimestream
      RetentionProperties:
        MemoryStoreRetentionPeriodInHours: 168
        MagneticStoreRetentionPeriodInDays: 365
New Lambda function
I will base the new function on the previous work. I will copy auth.py and
duplicate the template from the item seller. The new code will be in a new
directory called collect-stats. First file actions.py will be used for API
calls to Habitica. We will first define some constants and import requests. By
default Habitica returns a lot of data for stats fields so we will filter out
some of them.
import requests

HABITICA_URL="https://habitica.com/api/v3"
STATS_TO_GET = ['gp', 'exp', 'mp', 'lvl', 'hp']
Now we can construct the function that will do the API call and return the statistics we want to track. It will also return username that we will use later as a dimension. It is not required but it is nice to have.
def get_stats(headers: dict) -> tuple[str, dict]:
    url = f"{HABITICA_URL}/user?userFields=stats"

    response = requests.get(url, headers=headers)
    code = response.status_code

    if code == 200:
        user = response.json()['data']['auth']['local']['username']
        stats = response.json()['data']['stats']
        stats = {k: v for k, v in stats.items() if k in STATS_TO_GET}
        return user, stats

    raise Exception(response.json()['message'])
Next function is also very simple. It will just construct appropriate objects to
store in the Timestream table. We will use standard boto3 library and iterate
through all the measurements we want to save.
import boto3

def store_in_timestream(database: str, table: str, timestamp: float, username: str, stats: dict):
    dimensions = [ {'Name': 'username', 'Value': username} ]
    client = boto3.client('timestream-write')

    records = [
        {
            'Dimensions': dimensions,
            'MeasureName': stat,
            'MeasureValue': str(value),
            'MeasureValueType': 'DOUBLE',
            'Time': str(int(timestamp * 1000)),
            'TimeUnit': 'MILLISECONDS',
        }
        for stat, value in stats.items()
    ]

    client.write_records(DatabaseName=database, TableName=table, Records=records)
Now it's time to create main.py where we will glue together the two functions.
It will retrieve all the needed configuration from environment variables, such
as Timestream parameters and API key location. My function in the repository
also has some logging so that I can see errors.
from actions import get_stats
from store import store_in_timestream
from auth import get_headers
import os, datetime

HEADERS = get_headers()
DATABASE_NAME = os.getenv('DATABASE_NAME')
TABLE_NAME = os.getenv('TABLE_NAME')

def lambda_handler(event, context):

    current_utc = datetime.datetime.now(datetime.UTC)
    current_utc_string = current_utc.strftime("%Y-%m-%d %H:%M:%S %Z") # Such as 2024-07-03 21:10:05 UTC

    try:
        username, stats = get_stats(HEADERS)
        store_in_timestream(DATABASE_NAME, TABLE_NAME, current_utc.timestamp(), username, stats)
    except Exception as e:
        return {
            "statusCode": 500, # Mark as error
            "body": f"{current_utc_string}: {str(e)}"
        }

    return {
        "statusCode": 200, # Success
        "body": f"Collected statistics for time {current_utc_string}."
    }
Adding the function to SAM
I decided that my function will collect the data every 30 minutes. I don't think that anything more granular is necessary and 30 minutes gives smooth enough graph. In the same template as before, we need to reference the secret stored in Secrets Manager as well as the Timestream database and table.
  HabiticaCollectStats:
    Type: AWS::Serverless::Function
    Properties:
      CodeUri: collect_stats/
      Handler: main.lambda_handler
      Runtime: python3.12
      Architectures:
        - arm64
      Policies:
        - AWSSecretsManagerGetSecretValuePolicy:
            SecretArn: !Ref HabiticaSecret
      Environment:
        Variables:
          HABITICA_SECRET: !Ref HabiticaSecret
          DATABASE_NAME: !Ref HabiticaStatsTimestream
          TABLE_NAME: !Select [ "1", !Split [ "|", !Ref HabiticaStatsTable ] ]
      Events:
        Schedule30Min:
          Type: Schedule
          Properties:
            Schedule: cron(*/30 * * * ? *)
            Enabled: true
Because CloudFormation returns reference to the table as Database|Table, we
unfortunately have to split it and !Select the second element. However, this
is not the end! If we now wait for the function to run, we will see something
unexpected.
Error collecting stats at 2024-06-30 19:45:14 UTC: An error occurred
(AccessDeniedException) when calling the DescribeEndpoints operation: User:
arn:aws:sts::1234567890:assumed-role/habitica-item-seller-HabiticaCollectStatsRole...
is not authorized to perform: timestream:DescribeEndpoints
SAM doesn't have policy templates for Timestream, similar to the one we use for
Secrets Manager. However, we can define an inline policy directly. In the
Policies section add the following using a Statement object.
      Policies:
        - AWSSecretsManagerGetSecretValuePolicy:
            SecretArn: !Ref HabiticaSecret
        - Statement:
            - Effect: Allow
              Action:
                - timestream:WriteRecords
                - timestream:DescribeTable
              Resource: !GetAtt HabiticaStatsTable.Arn
            - Effect: Allow
              Action:
                - timestream:DescribeEndpoints
              Resource: "*"
In the directory you have template.yaml run sam build. If this is the first
time running SAM, use sam deploy --guided to deploy the stack. Otherwise just
sam deploy is sufficient.
All updates to the Lambda side of the project can be found in the new v2 tag
in here: https://github.com/ppabis/habitica-item-seller/tree/v2.
Querying Timestream for collected records
If everything looks correct in CloudWatch logs and there are no errors in the
Monitoring tab of the Lambda function, you can peek into the Timestream
database. In the Timestream console, select Tables in the left pane, click on
your table (verify if you are in the right region) and in the top-right
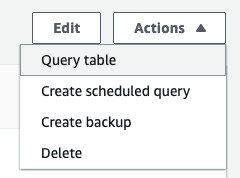
Actions select Query. Run the following example query. Depending on your
schedule, you should see some records.
SELECT * FROM "HabiticaStats"."HabiticaStatsTable" WHERE time between ago(3h) and now() ORDER BY time DESC LIMIT 10
Configuring Grafana
I created a Terraform repository for spawning Grafana on EC2 instance. It is
easier to manage files than in CloudFormation. I will just install Docker and
docker-compose on the instance and run Grafana. Because it will have
authentication it is smart to have any means of encryption so I will put it
behind Nginx with self-signed certificate. You can risk using plaintext, or use
VPN, SSH tunnel or ALB alternatively.
But let's start with the configuration. I will skip VPC creation part, providers and jump directly to the interesting parts. For the complete project follow this link. First, we will create Grafana config that will set up our admin user and password. It will also allow any origin to connect as I did not configure any domains.
[server]
enforce_domain = false

[security]
disable_initial_admin_creation = false
admin_user = secretadmin
admin_password = PassWord-100-200
cookie_secure = true
cookie_samesite = none
Next up is Nginx configuration. This is just a simple reverse proxy with TLS.
You can also set up HTTP to HTTPS redirection. The host name in proxy_pass
needs to match the name of the container in docker-compose.yml which we will
define next. We will handle certificates in a later stage.
server {
    listen 443 ssl;
    server_name _;

    ssl_certificate /etc/nginx/ssl/selfsigned.crt;
    ssl_certificate_key /etc/nginx/ssl/selfsigned.key;

    location / {
        proxy_pass http://grafana:3000;
        proxy_set_header Host $host;
        proxy_set_header X-Real-IP $remote_addr;
        proxy_set_header X-Forwarded-For $proxy_add_x_forwarded_for;
    }
}
Next we will create Docker compose file. It will create a common network for the two containers, mount the configuration and data directories and expose Nginx's port so that it is accessible from the Internet. For Grafana, it is also important to set the user and group that will be able to write to the directory. The environment variables will be picked up from user data script at the later stage.
---
networks:
  habitica-stats:
    driver: bridge

services:
  grafana:
    image: grafana/grafana:latest
    volumes:
      - /opt/grafana:/var/lib/grafana
      - /opt/grafana.ini:/etc/grafana/grafana.ini
    user: "${RUN_AS_ID}:${RUN_AS_GROUP}"
    networks:
      - habitica-stats
    restart: always

  nginx:
    image: nginx:latest
    volumes:
      - /opt/nginx/nginx.conf:/etc/nginx/conf.d/default.conf
      - /opt/nginx/selfsigned.crt:/etc/nginx/ssl/selfsigned.crt
      - /opt/nginx/selfsigned.key:/etc/nginx/ssl/selfsigned.key
    ports:
      - 443:443
    networks:
      - habitica-stats
    restart: always
All of the above files are small and can be stored in SSM Parameter Store. It is
more convenient than copying them over through S3. In Terraform I defined three
parameters. I suggest keeping the Grafana configuration as SecureString as it
contains the password.
resource "aws_ssm_parameter" "grafana_ini" {
  name = "/habitica-stats/grafana/ini"
  type = "SecureString"
  value = file("./resources/sample.ini")
}

resource "aws_ssm_parameter" "nginx_conf" {
  name  = "/habitica-stats/nginx/conf"
  type  = "String"
  value = file("./resources/nginx.conf")
}

resource "aws_ssm_parameter" "docker_compose" {
  name  = "/habitica-stats/docker_compose"
  type  = "String"
  value = file("./resources/docker-compose.yml")
}
Now, as we know the names of the parameters we can define our user data file. It will run as we create the instance and download all the parameters to their respective files. Important to note is that this instance requires IPv4 connection to the Internet. I tried using just IPv6 and it was shaving a yak to copy over everything with S3 or other means. GitHub doesn't support IPv6. Grafana plugins are not accessible through IPv6. So either give your instance a public IPv4 address or use NAT Gateway.
The script below will do the following:
- Install Docker and
docker-compose - Create configuration for Grafana
- Create configuration for Nginx including self-signed SSL
- Start the containers using compose file
#!/bin/bash
# Docker and docker-compose installation
yum install -y docker
systemctl enable --now docker
curl -o /usr/local/bin/docker-compose -L "https://github.com/docker/compose/releases/download/v2.28.1/docker-compose-linux-aarch64"
chmod +x /usr/local/bin/docker-compose

# Grafana configuration
useradd -r -s /sbin/nologin grafana
mkdir -p /opt/grafana
chown -R grafana:grafana /opt/grafana
aws ssm get-parameter --name ${param_grafana_ini} --with-decryption --query Parameter.Value --output text > /opt/grafana.ini
chown grafana:grafana /opt/grafana.ini

# Nginx configuration
mkdir -p /opt/nginx
openssl req -x509 -nodes -days 365 -newkey rsa:2048 -keyout /opt/nginx/selfsigned.key -out /opt/nginx/selfsigned.crt -subj "/CN=grafana"
aws ssm get-parameter --name ${param_nginx_conf} --query Parameter.Value --output text > /opt/nginx/nginx.conf

# Run the stack
# Docker compose picks up environment variables just as shell scripts
export RUN_AS_ID=$(id -u grafana)
export RUN_AS_GROUP=$(id -g grafana)
aws ssm get-parameter --name ${param_docker_compose} --query Parameter.Value --output text > /opt/docker-compose.yml
docker-compose -f /opt/docker-compose.yml up -d
IAM profile for the instance
In order to allow Grafana to read from Timestream, we will need to grant
permissions to the EC2 instance. I attached two policies for simplicity:
AmazonSSMManagedInstanceCore which will allow access to SSM Parameters and in
case we need to debug to SSM Session Manager, and
AmazonTimestreamReadOnlyAccess that allows Grafana to not only query the
database but also list databases and tables that will make the UI usable for
configuration. You can adapt it to your needs by importing exporting the outputs
from SAM template and importing them in Terraform using data provider
aws_cloudformation_export.
resource "aws_iam_instance_profile" "grafana_ec2_profile" {
  name = "grafana_ec2-profile"
  role = aws_iam_role.grafana_ec2_role.name
}

resource "aws_iam_role" "grafana_ec2_role" {
  name = "grafana_ec2-role"
  assume_role_policy = jsonencode({
    Version = "2012-10-17"
    Statement = [{
      Effect = "Allow"
      Principal = { Service = "ec2.amazonaws.com" }
      Action = "sts:AssumeRole"
    }]
  })
}

resource "aws_iam_role_policy_attachment" "ssm" {
  role       = aws_iam_role.grafana_ec2_role.name
  policy_arn = "arn:aws:iam::aws:policy/AmazonSSMManagedInstanceCore"
}

resource "aws_iam_role_policy_attachment" "timestream" {
  role       = aws_iam_role.grafana_ec2_role.name
  policy_arn = "arn:aws:iam::aws:policy/AmazonTimestreamReadOnlyAccess"
}
Creating new instance
For the instance we also need a security group. I will allow HTTPS traffic from
any IPv6 address and from my home IPv4 address on port 443. My AMI choice is
standard Amazon Linux 2023 and I will use a Graviton instance as it's cheaper.
If you want to keep it in your free tier, use t2.micro or t2.nano.
resource "aws_security_group" "grafana_sg" {
  vpc_id = aws_vpc.vpc.id
  name   = "grafana-sg"

  egress {
    from_port        = 0
    to_port          = 0
    protocol         = "-1"
    cidr_blocks      = ["0.0.0.0/0"]
    ipv6_cidr_blocks = ["::/0"]
  }

  ingress {
    from_port = 443
    to_port   = 443
    protocol  = "tcp"
    # This will allow anyone to acecss via HTTPS when using IPv6 or just your IPv4
    ipv6_cidr_blocks = ["::/0"]
    cidr_blocks      = ["12.13.14.15/32"]
  }
}
For IPv4 I will associate a public IP address. If you have a running NAT Gateway
it might be a better idea to use it instead. The user data script is a template
that should be filled with the names of the SSM parameters we created before. I
will also produce outputs of the IPs concatenated with https:// so that I have
easy access to the service.
resource "aws_instance" "grafana" {
  ami                         = data.aws_ssm_parameter.al2023.value
  instance_type               = "t4g.micro"
  vpc_security_group_ids      = [aws_security_group.grafana_sg.id]
  subnet_id                   = aws_subnet.public.id
  associate_public_ip_address = true
  ipv6_address_count          = 1
  iam_instance_profile        = aws_iam_instance_profile.grafana_ec2_profile.name

  user_data = templatefile("./resources/user-data.sh", {
    param_docker_compose = aws_ssm_parameter.docker_compose.name,
    param_nginx_conf     = aws_ssm_parameter.nginx_conf.name,
    param_grafana_ini    = aws_ssm_parameter.grafana_ini.name
  })

  tags = { Name = "grafana-ec2" }
}

output "site_ipv6" { value = "https://[${aws_instance.grafana.ipv6_addresses[0]}]" }
output "site_ipv4" { value = "https://${aws_instance.grafana.public_ip}" }
The completed Grafana instance project can be found here. It might take some time to boot and create all the containers, so leave it for a few minutes after all the Terraform processes are done.
$ tofu init
$ tofu apply
Configuring Grafana
Now the final part is configuring Grafana connections and dashboards. Go to the
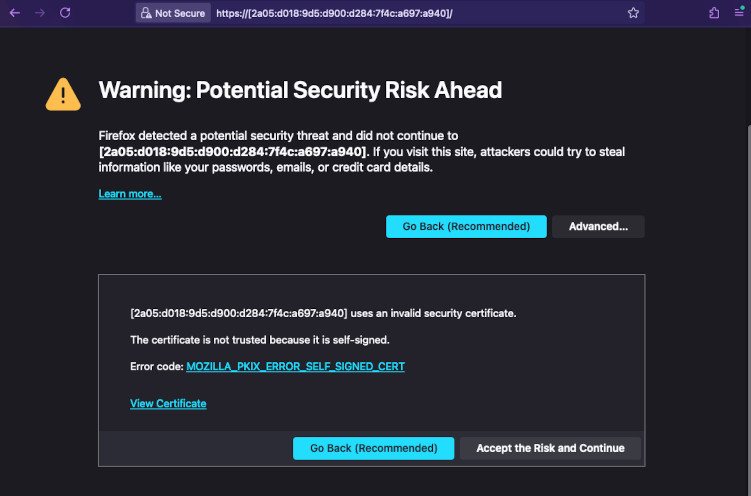
address that you got as an output. The certificate is self-signed so you will
get a warning. Accept it and log in with the credentials you set up in
grafana.ini.
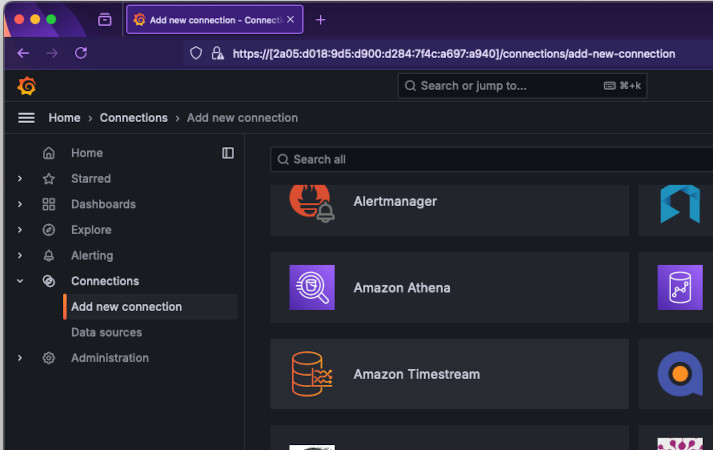
Select Connections -> Add new connection. Search for Timestream. Install it
in the top-right and again in the same spot click Add new data source.
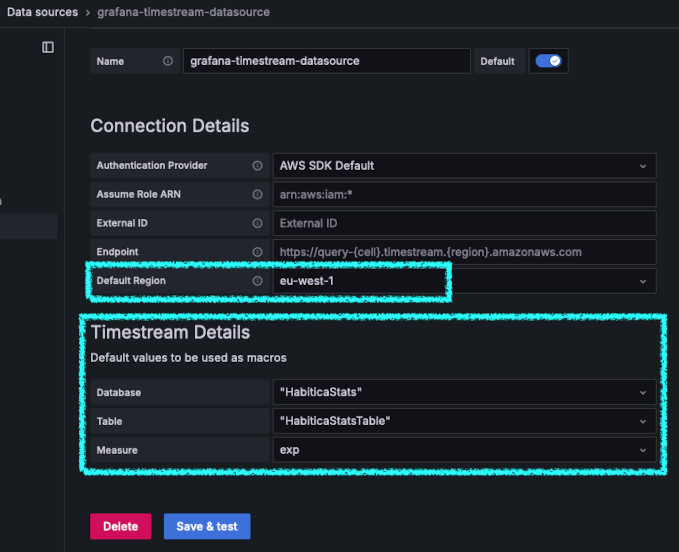
The first thing you have to select is a region where your Timestream database is. Then you should be able to select the database and table from the dropdown.
Once you added the data source, you can create a new dashboard. On the left hand
side click Dashboards and create a new one. Select Timestream data source and
in the query editor write such query. You can use it for every graph you create.
Change the measured value on the left to choose. Click Apply to save the graph
to the dashboard.
SELECT * FROM $__database.$__table WHERE measure_name = '$__measure'
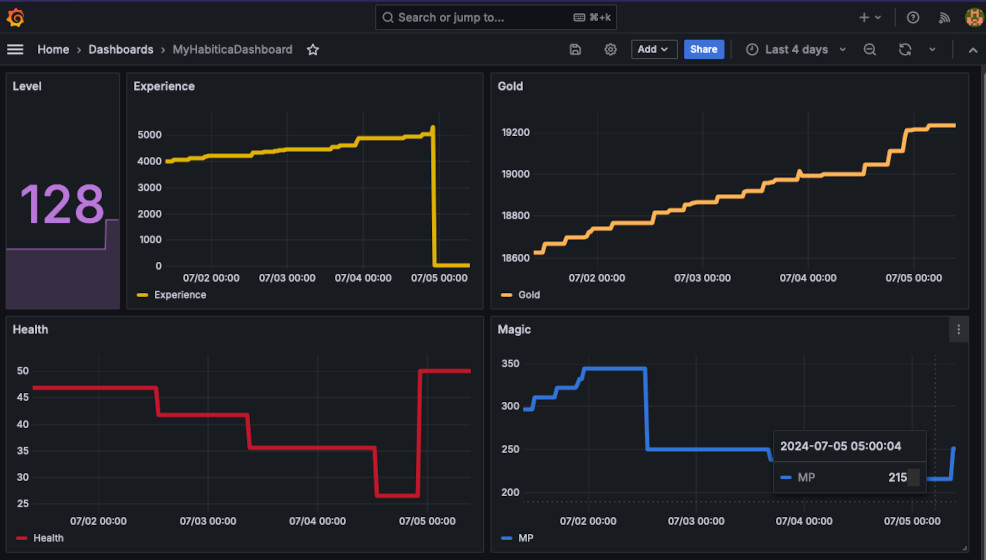
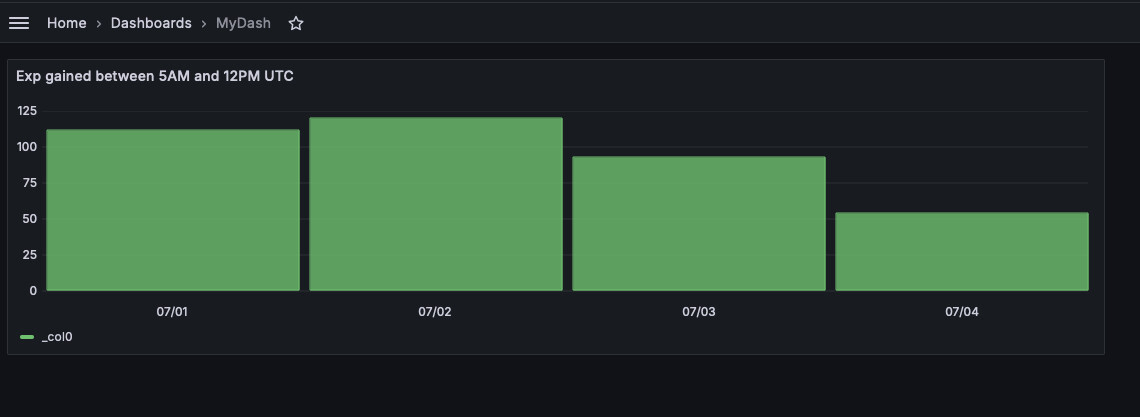
You can then create a dashboard that will track your habits and tasks progress as an overall overview. You can also create a graph that will compare how well do your mornings look like (how much exp do you gain between 6 and 10 AM). To do this, set your graph type to bar chart and put the following long query.
WITH morning_values AS (
    SELECT
        date_trunc('day', time) AS day,
        measure_value::double AS value_at_time,
        CASE
            WHEN extract(hour from time) = 6 THEN 'value_at_6am'
            WHEN extract(hour from time) = 10 THEN 'value_at_10am'
        END AS time_period
    FROM
        $__database.$__table
    WHERE
        (extract(hour from time) = 6
        OR extract(hour from time) = 10)
        AND measure_name = '$__measure'
),
aggregated_values AS (
    SELECT
        day,
        MAX(CASE WHEN time_period = 'value_at_6am' THEN value_at_time ELSE NULL END) AS value_at_6am,
        MAX(CASE WHEN time_period = 'value_at_10am' THEN value_at_time ELSE NULL END) AS value_at_10am
    FROM
        morning_values
    GROUP BY
        day
)
SELECT
    value_at_10am - value_at_6am,
    day
FROM
    aggregated_values
ORDER BY
    day ASC
It will do the following: first it will find all the measurements that happened at 6AM UTC or 10AM UTC (6:00-6:59 to be exact). Then it will take the largest of the values (so more likely 6:59 than 6:00) and pass it to another query that will group those values it by days. So we will have 1st July with two values, 2nd of July with two values, etc. Finally, for each day we will subtract 6AM measured value from 10AM measured value. Of course I didn't write this query myself. But I like the effect nevertheless. Because of UTC storage I expanded the window from 5AM to 12PM.
